
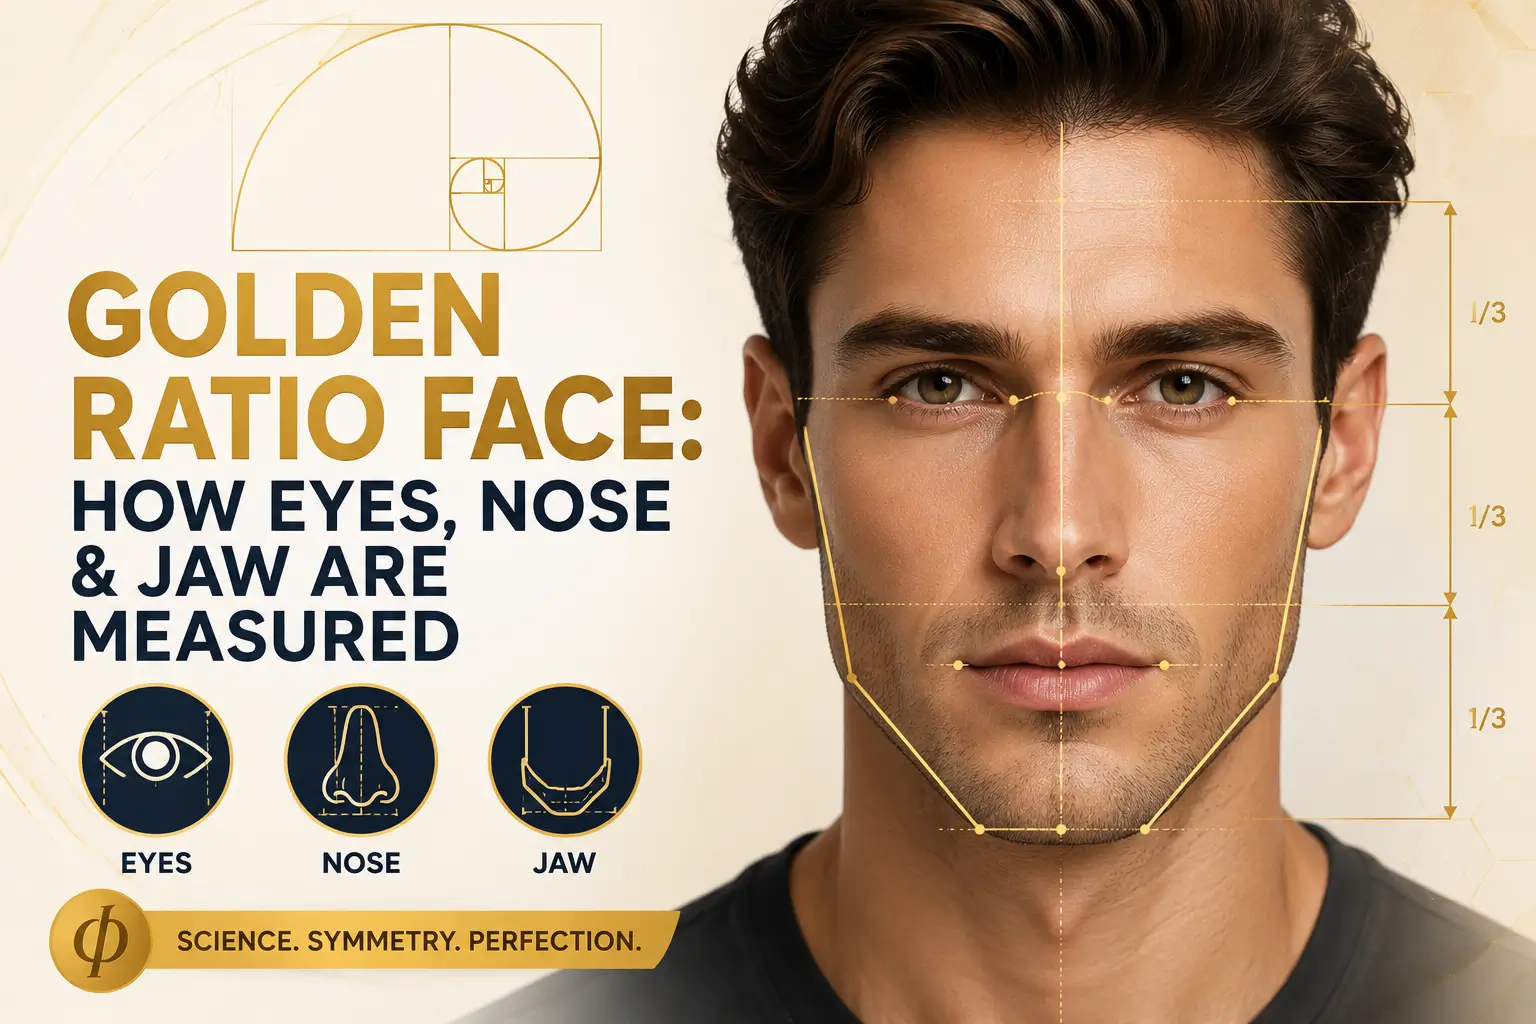
Quick Answer:
The golden ratio, or phi (φ ≈ 1.618), is applied to a face by comparing key distances — face length to width, eye spacing to mouth width, nose length to lip position — against that 1.618:1 proportion. In practice, most faces don’t hit phi exactly, and peer-reviewed research has found the “ideal” numbers are actually closer to an average face’s proportions than to strict phi.
Key takeaways
- Phi (φ) = 1.618:1. On a face, it’s checked mainly across three measurements: length-to-width, eye spacing-to-mouth width, and nose-to-lip proportions.
- A 2010 University of California, San Diego study found the truly optimal ratios (36% eye-to-mouth, 46% interocular width) match an average face, not exactly 1.618.
- Dr. Stephen Marquardt’s “phi mask,” the tool most golden-ratio face calculators are built on, has been formally critiqued for fitting European fashion-model proportions better than other populations.
- Oblong faces sit numerically closest to 1.618 on the length-to-width measurement; oval faces sit closer to 1.3–1.4, which is why oval scores as more “balanced” than “golden-ratio perfect.”
- A golden ratio score measures geometry, not attractiveness — it’s one data point, not a verdict.
Who this is for:
Anyone who’s seen a “golden ratio face score” from an app or filter and wants to know what’s actually being measured — and, specifically, oval-face-shaped readers trying to understand why their proportions register differently from an “oblong” or classic-phi result.
Use this before you rely on any online face-ratio calculator for styling decisions, or before assuming a low golden-ratio score means anything about attractiveness.
What the Golden Ratio Actually Means on a Face?
Phi is a mathematical proportion, first described in Euclidean geometry, later associated with Renaissance art and architecture.
Applied to a face, three comparisons come up most often:
- Length-to-width: total face length ÷ face width. Phi predicts ≈1.618:1.
- Eye spacing-to-mouth width: the horizontal distance between the eyes compared with mouth width.
- Nose-to-lip proportion: nose length compared with the distance from the base of the nose to the chin.
These three are called “facial landmarks” — fixed, identifiable points (pupil centers, nose base, chin point, jaw corners) that any measurement method, human or AI, uses as reference marks.
How It’s Calculated in Practice?
Most consumer “golden ratio face” tools are built on a version of the Phi Mask, a proportional template developed by oral and maxillofacial surgeon Dr. Stephen Marquardt in the late 1990s, which overlays a decagon-based grid derived from phi onto a front-facing photo. Modern apps replace the manual overlay with AI landmark detection — typically 68 reference points per face — measured against the same target ratios.
The math itself is simple: divide one measurement by another and compare it to 1.618. The harder question, which the research below addresses, is whether 1.618 is actually the number that predicts what people find balanced.
What the Research Actually Found?
This is where most golden-ratio content stops short.
Two findings matter:
The “ideal” ratio isn’t quite phi. A study by Pallett, Link, and Lee at UC San Diego and the University of Toronto tested attractiveness ratings across faces with identical features but different spacing.
They found female faces were judged more attractive when the vertical distance between the eyes and mouth was about 36% of face length, and the horizontal distance between the eyes was about 46% of face width — proportions that match an average face rather than strict 1.618 (Pallett, Link & Lee, 2010, Vision Research). ScienceDirect
Marquardt’s mask doesn’t generalize well. A peer-reviewed critique in Aesthetic Plastic Surgery examined the mask’s fit across populations and found it best describes masculinized white women, similar to fashion models, and is ill-suited to non-European populations, especially East Asian and sub-Saharan African faces (Holland, 2008, Aesthetic Plastic Surgery).
Separate anthropometric work by Farkas and colleagues found the “ideal” neoclassical facial canons differ measurably between Caucasian, Han Chinese, Afro-American, and Arabian Peninsula populations — reinforcing that there’s no single universal ratio.
Building the landmark-detection tool on OvalFaceShape.com surfaced the same issue in practice: two photos of the same face, shot at slightly different angles or lighting, can shift a golden-ratio score by several points — which is exactly the kind of measurement noise the peer-reviewed critiques point to, not a flaw unique to any one calculator.
Which Face Shapes Score Closest to “Phi”?
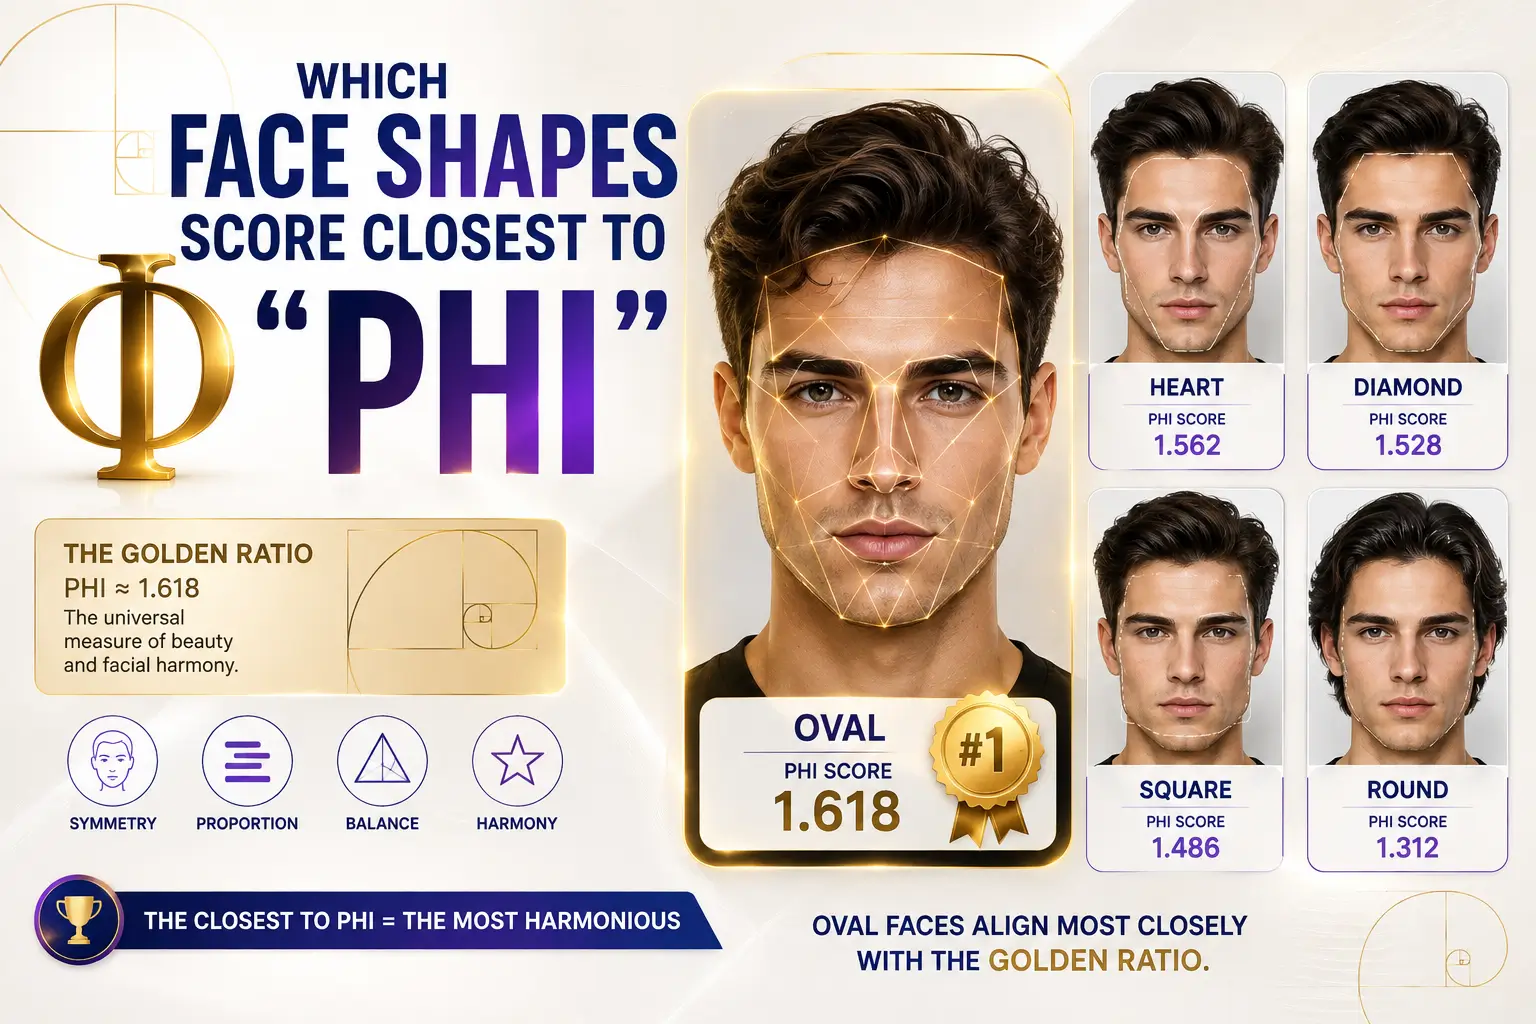
| Face shape | Typical length-to-width | Distance from 1.618 |
|---|---|---|
| Oblong | 1.5–1.65 | Closest |
| Oval | 1.25–1.45 | Moderate |
| Diamond / Heart | 1.15–1.45 | Moderate |
| Square | 1.05–1.20 | Furthest |
| Round | ≈1.0 | Furthest |
Scoring closest to phi on this one measurement isn’t the same as scoring highest for perceived harmony — the oval-shape range consistently rates well in balance and symmetry research even though it sits below 1.618. See the full oval face shape guide for what that balance means for styling.
How to Check Your Own Proportions?
- Take a straight-on, neutral-expression photo in even lighting.
- Measure (or use the face shape detector) face length (hairline to chin) and width (cheekbone to cheekbone).
- Divide length by width. Compare to 1.618 — but treat 1.3–1.5 as a normal, common range, not a “failing” score.
- Measure eye spacing against mouth width, and nose length against lower-face height, using the same method.
- Cross-check your result against your face shape category rather than reading it in isolation.
The Limits of a Golden Ratio Score
A golden-ratio measurement describes geometry — it doesn’t account for symmetry, skin, expression, cultural context, or the dozens of other variables attractiveness research points to. It’s a styling data point, not a diagnosis and not a verdict on appearance.
FAQs
Does a high golden ratio score mean I’m conventionally attractive?
No. It measures one set of proportions, not attractiveness overall — symmetry, skin, and expression all factor in separately, and research shows average proportions, not strict phi, correlate best with attractiveness ratings.
Is the golden ratio still considered valid in facial analysis in 2026?
Partly. It’s still used as a rough proportional benchmark, but peer-reviewed research has repeatedly shown the “true” optimal ratios sit closer to population averages than to exact phi.
What’s the difference between the golden ratio and Marquardt’s Phi Mask?
The golden ratio is the underlying 1.618 proportion; the Phi Mask is Marquardt’s specific decagon-based template built from it, which has been critiqued for fitting some populations far better than others.
How do I calculate my own golden ratio face score at home?
Divide your face length by its width, and compare eye spacing to mouth width, using a straight-on photo — no special software or cost required, though AI landmark tools reduce manual measurement error.
Why do different golden ratio calculators give me different scores?
Landmark detection is sensitive to camera angle, lighting, and which points each tool anchors to — small measurement shifts change the ratio, which is part of why researchers have questioned rigid phi-based scoring.
Which face shape scores closest to the golden ratio?
Oblong, on the length-to-width measurement specifically — oval sits in a lower but still commonly-cited range.
Can changing your hairstyle or glasses change your measured ratio?
No — styling can change how proportions appear visually, but a golden-ratio calculation is based on bone-level landmarks that styling doesn’t alter.