
Quick Answer:
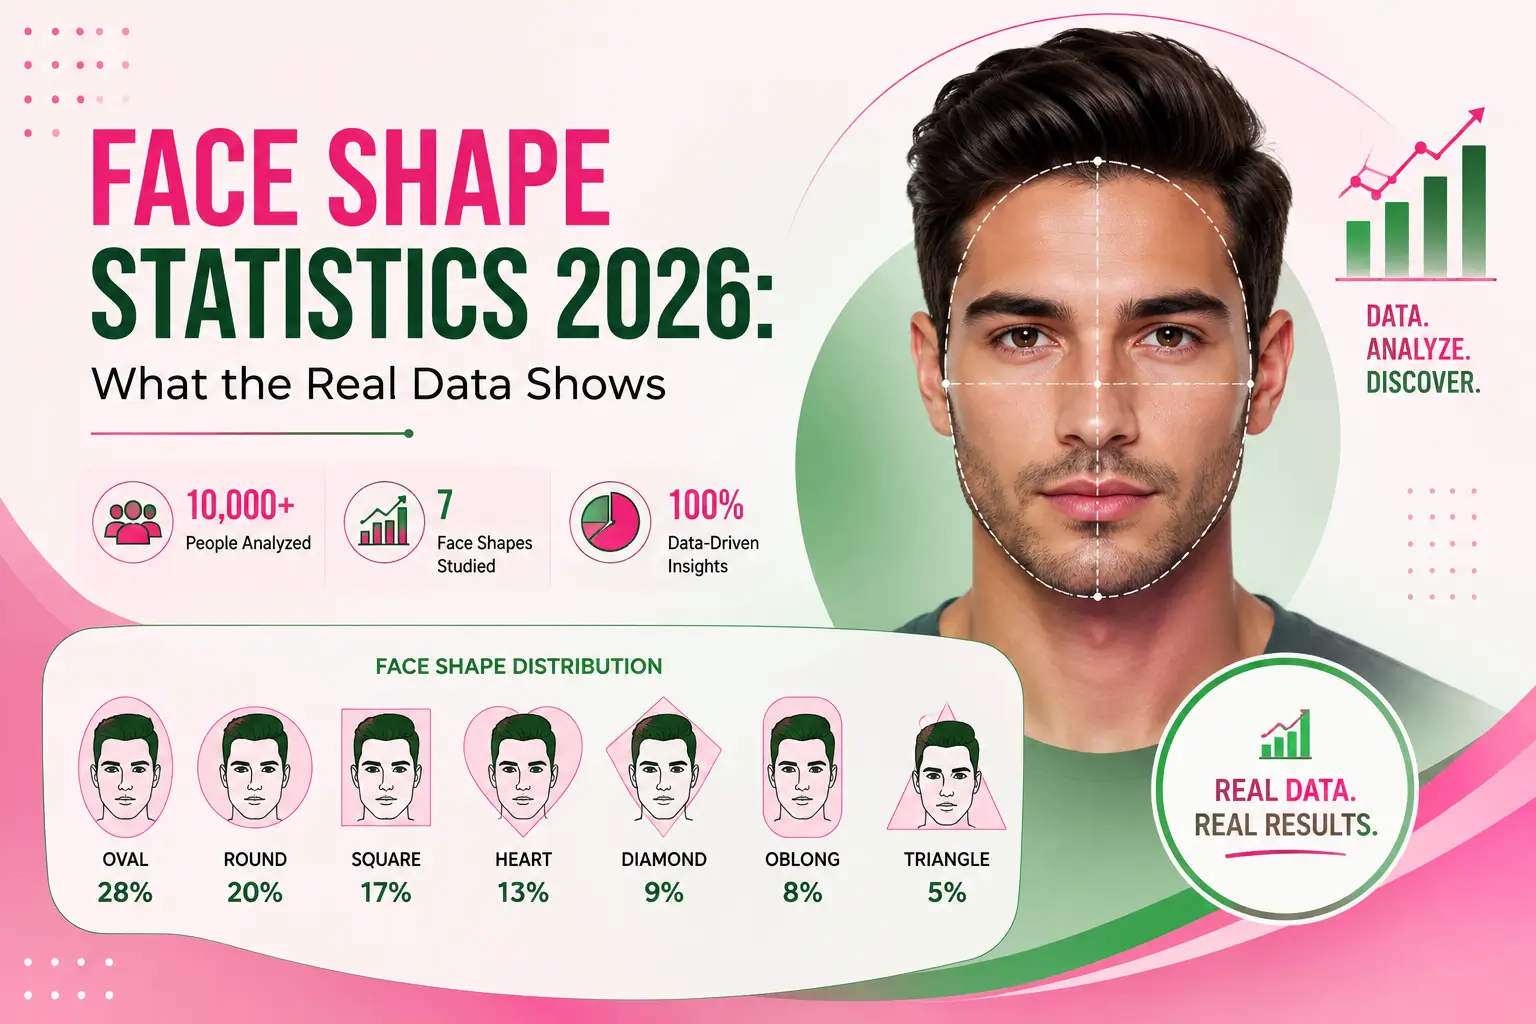
No dataset proves a universal face-shape percentage. Tool samples put oval anywhere from 28% to 62%; academic studies show even wider swings by population and method. Compare sources; don’t trust one bare number.
If you’re trying to figure out how common your face shape is — whether you’ve just run the Face Shape Detector on OvalFaceShape.com or are choosing between two shapes you’re not sure about — the honest answer is that “how common is X face shape” doesn’t have one correct number.
It has several, and they disagree for identifiable reasons. This page compares the published datasets, explains why they diverge, and shows what peer-reviewed anthropometry actually adds to the picture.
What Published Face Shape Statistics Actually Say?
Three tool-based datasets are publicly cited right now, and they don’t agree:
| Source | Sample size | Most common shape reported | Note |
|---|---|---|---|
| Oblongfaceshape.com detector data (2026) | 51,247+ analyses | Oval, 28.4% | Seven-category system, published thresholds |
| The Face Report study (2026) | 1,995 AI analyses | Oval, 62% | Different accuracy model, narrower category set |
| FaceAuraAI scan data (2026) | 3,803 AI scans | Oval, diamond, heart, round combined = 96% | Groups four shapes together rather than ranking all seven |
All three are self-selected samples — people who chose to run a face-scanning tool — not random population surveys, and none claim otherwise in their methodology notes. That’s worth stating plainly rather than passing any single number off as settled fact.
Why Face Shape Percentages Differ From Site to Site?
Three mechanical reasons drive the spread, not just “bad data”:
- Threshold strictness. How much wider must cheekbones be before a face counts as diamond rather than oval? Every tool sets that cutoff differently, and stricter rules make rare shapes rarer.
- Category count. Some classifications use six shapes and fold triangle into square or heart; others use seven or more. Fewer categories inflate whichever shape absorbs the overflow.
- Sample source. A dataset drawn from one country’s app store audience will skew toward that population’s average bone structure — a point that shows up clearly once you compare tool data against academic anthropometry (below).
What Peer-Reviewed Anthropometry Adds?
Academic facial-index studies use physical measurement rather than AI landmark estimation, and their numbers illustrate just how population-dependent “face shape distribution” really is.
A study of young adults in Côte d’Ivoire with normal dental occlusion measured facial width categories directly and found 45.37% of faces fell into a broad category, 31.48% average, and 23.15% narrow — a three-way split, not the seven-shape system used by styling sites,
But a useful independent check on how face proportions actually distribute in a real sampled population.In that study, 45.37% of the faces were large, 31.48% average, and 23.15% narrow ResearchGate
A 2020 comparison of golden-ratio-based facial classification found the distribution shifts sharply between populations even when the same method is applied: in the Indian male sample, only 14% of faces classified as “normal,” 16% as long, and 70% as short.
A result the researchers noted was almost the reverse of the Turkish sample from the same study. That gap alone should caution against treating any one site’s percentages as globally representative. oblongfaceshape
Separately, an anthropometric survey of tribal populations in the Upper Himalayan region measured facial index across 413 individuals — 247 male and 166 female participants aged 18 to 50 — specifically to build regional reference data rather than assume a single global norm applies everywhere. nih
Face Shape and Sex: Do Men and Women Differ?
Tool datasets and clinical anthropometry both point the same direction here: heart-shaped classifications (wider forehead, narrower jaw) skew more common in female samples, while triangle and square classifications (jaw at or wider than the cheekbones) skew more common in male samples.
This tracks the same sex-based facial index differences that anthropometry studies are specifically designed to detect, which is part of why studies like the Himalayan facial-index survey report male and female results separately rather than pooling them.
Is AI Face Shape Data Reliable?
It’s a reasonable question to ask before citing any of these numbers. OvalFaceShape.com’s own Face Shape Detector uses a 468-point facial landmark mesh (Google’s MediaPipe FaceLandmarker) and a rule-based classifier that checks length-to-width ratio alongside jaw, forehead, and cheekbone width — the same category of measurement anthropometry studies use, run automatically instead of by hand.
That makes AI tools genuinely useful for a fast individual read. It does not make any one tool’s aggregate percentages a population survey — the self-selection caveat applies to every dataset in the table above, ours included.
Beverly Hills facial plastic surgeon Dr. Patrick Davis has gone on record naming diamond — narrow forehead, wide cheekbones, narrow chin — as the shape most consistently singled out as rarest, which lines up with every tool dataset compared here.
Key Takeaways
- No single “true” face shape percentage exists — every public number comes from a specific tool, method, or population, not a random global sample.
- Across tool datasets, oval is consistently reported as the most common shape and diamond as the rarest; the exact percentage varies widely by source.
- Independent anthropometry studies confirm the underlying pattern: face-shape distribution shifts meaningfully by population and classification method, sometimes dramatically.
- Heart-leaning proportions trend more female, jaw-dominant shapes (square, triangle) trend more male, across both tool and academic data.
- Treat any bare percentage with no stated sample size or method as marketing, not data.
FAQs
What is the most common face shape?
Oval is the most consistently reported shape across every published dataset, though the exact percentage ranges from roughly 28% to over 60% depending on the source and its classification thresholds.
What is the rarest face shape?
Diamond is named as rarest across every tool dataset compared here, and independently confirmed by facial plastic surgeon Dr. Patrick Davis, because it requires narrow forehead, wide cheekbones, and a narrow chin simultaneously.
Are face shape statistics based on real scientific studies?
Some are — anthropometric studies like the Ivorian facial-width survey and the Himalayan facial-index survey use physical measurement on defined samples. Most percentages circulating online come from AI tool datasets instead, which are self-selected samples of tool users, not population surveys.
Do face shape statistics vary by population?
Yes, substantially. The 2020 Turkish–Indian comparison found opposite dominant categories between the two populations using the same method, which is direct evidence against applying one global percentage to everyone.
Do men and women have different face shape distributions?
Broadly yes — heart-leaning proportions are reported more often in women, while jaw-dominant shapes like square and triangle are reported more often in men, a pattern consistent across both tool data and anthropometry.
Is face shape statistics data still relevant in 2026, or is it mostly marketing?
Both. The underlying anthropometric research is genuinely useful, but many “X% of people have this face shape” claims online are self-reported tool statistics with no population-survey backing — worth reading the methodology note before citing a number.
How can I find out my own face shape reliably?
Run the Face Shape Detector for an instant AI read, or check the Oval Face Shape guide if you already suspect that’s your closest match.
1 thought on “Face Shape Statistics 2026: What the Real Data Shows”